Hypermedia Online Publishing: the Transformation of the Scholarly Journal
7.3.4 Advantages of electronic scholarly publishing
These questions asked respondents to rate a number of possible advantages of electronically published scholarly articles on a five-point Likert scale running from Strongly Agree through to Strongly Disagree (SD). The advantages were gathered from a close reading of the critical literature dealing with electronic scholarly journals. Respondents were also encouraged to add other advantages if they wished to. In fact only 17 of the 1038 respondents (1.6%) added one additional advantage and only 4 added a second.
All of the contingency tables for the print subgroups for this set of questions contained cells with expected values of less than 5 and so the print responses were aggregated and compared with the email responses for each question. Even then, it was only possible to derive valid statistical results for two of the advantages questions: A-Paper and A-Affordability. This was because most of the contingency tables by Survey also had expected cells with values less than 5. Therefore, for the majority of the advantages questions only the observed values will be reported and no statistical results are available.
Speed of publication
|
|
One of the advantages of e-journals is that they can be published as soon as the articles have been accepted. There is no need to wait for a gap some months hence in a crowded printing schedule. In some e-journals there is not even a wait for an issues to become ready; articles are published on their own as soon as they are ready. With the increasing pace of research delay to publication in the print literature is becoming a serious problem.
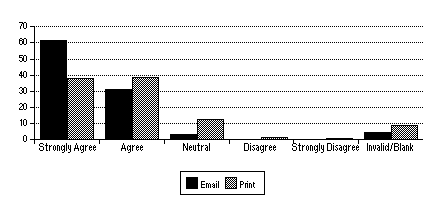
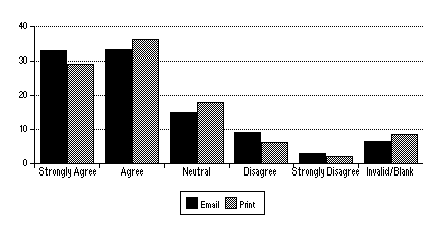
Both groups of respondents are very positive about this advantage, with almost 90% of the responses at Neutral or better. The email respondents are definitely more positive than the print respondents, strongly agreeing in a ratio of 3:2. Notably nearly 10% of the print respondents left this question blank. Figure 7-1 shows the pattern of responses of declining positive responses very clearly.
24 hour access
|
|
Unless one subscribes personally to a journal (or has a large collection of copied articles/reprints) one is restricted to the hours in which the library is open. On-line journals are available all the time (provided one has the necessary equipment, the licensing arrangements are in place and the network is working!). This is still likely to be significantly better than the library hours.
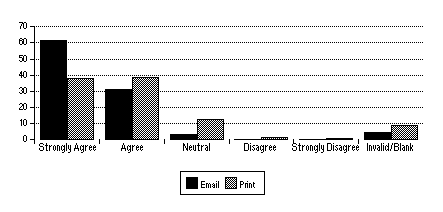
In this case the percentages for each Likert rating are nearly identical for each group of respondents, with the exception of a slightly greater number of blank answers. Both groups are again very positive about this advantage with nearly 90% of answers at the level of Strongly Agree or Agree.
Convenience
|
|
By convenience this question meant that e-journals were easy to access. An example might be that e-journals are potentially available from the researcher's desk rather than requiring a trip to the serials section of the library.
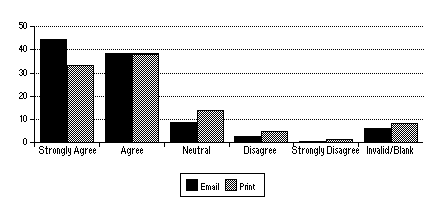
The answers to this question show a very similar pattern of responses to the A-Speed questions (Table 7-28). In this case the email respondents do not exceed the level of strong agreement of the print respondents to the same extent. In fact on the Agree measure the reverse is the case.
Feedback
|
|
The feedback processes for the print literature can be divided into public and private. Public feedback is largely restricted to letters to the editor which often appear one (or more often two) issues of the journal later and are necessarily restricted in space. Private feedback occurs via letter or email (if an email address is provided). E-journals allow for immediate private feedback via clickable email links. Public feedback can occur via on-line comments (as used by JIME), an associated mailing list or newsgroup or a Web-based conference. The reader of the article is much more aware of the discourse around the article and the community of scholars actively debating the ideas contained in it.
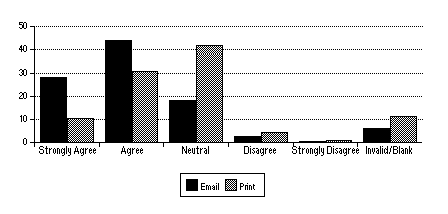
The email respondents were markedly more in agreement (nearly 70% strongly agreeing or agreeing) with this advantage than were the print respondents (only 40% at the same level of agreement). Over 40% of the print respondents were neutral about this advantage.
Reduced paper.
|
|
Despite the always imminent but apparently illusory advent of the paperless office, a shift to scholarly e-journals holds out the promise of some reduction in paper consumption. There is some anecdotal evidence that most readers of a journal are interested in only about 10% of the articles in any given issue. Having the articles available on-line allows a reader to view them onscreen before printing them if necessary. John Warnock, CEO of Adobe Systems, talks about moving from a Print then Distribute model to Distribute then Print. E-journals provide this electronic distribution function very well. It is also possible to keep e-journal articles in electronic form as part of a scholar's personal document database for later use and reuse.
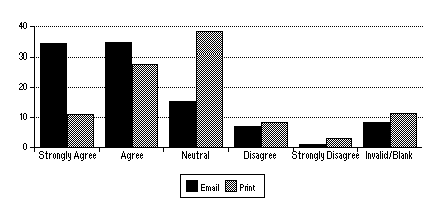
There is a statistically significant (p = 0.0011) difference between email and print respondents for this question. The email respondents strongly agree more than expected, but agree less than expected. Overall, agreement with this advantage is lower (more neutral, disagree and strongly disagree responses) than for the advantages discussed already. The respondents are still positive towards this advantage (65% agree or strongly agree overall).
Searching
|
|
One of the problems with print publications is that they are not directly searchable. For this reason the last twenty years has seen a dramatic growth in the availability of searchable document 'surrogates' like indexes and abstracts (initially via a proprietary on-line service, then on CD-ROM, and now probably via the Internet). One of the attractions of e-journal articles is the ability to search the entire text of a journal (or even set of journals) directly.
Over 50% of the respondents either strongly agreed or agreed that this was an advantage. Nearly 20% of each population was neutral. Less than 10% of the respondents disagreed or strongly disagreed that ease of searching was an advantage.
Multimedia
|
|
One of the advantages of moving away from print and towards electronic delivery of scholarly journals is the ability to include more multimedia content (more because paper is still a medium). Such content might just be colour (which was too expensive in print) or it might be dynamic content like video clips or animations. It might even be sound files or embedded simulations. These are all things that are unfamiliar within the context of a scholarly journal but which could obviously add to the quality of the communicative transaction.
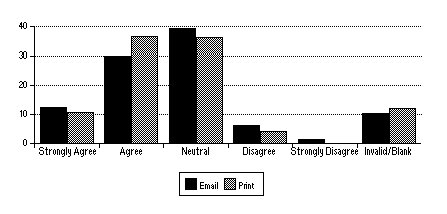
Both print and email respondents were more tentative about this advantage. A higher proportion than for the earlier advantage questions (around 10% of both populations) left this question blank and neutral was the most popular response for both populations. The level of strong agreement was also very low. This perhaps reflects users' uncertainty about (and lack of familiarity with) such content.
Affordability
|
|
One of the ongoing debates around e-journals has been the effect of removing the need for physical distribution of paper on the overall cost. A number of e-journals are still available free on-line but some are only available on a subscription or site license basis. This question sought to determine if respondents felt that affordability of e-journals was an advantage.
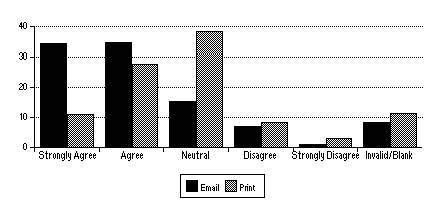
This question reveals a large difference between the two respondent populations. The differences are significant (p < 0.001). The email respondents were much more optimistic about the advantages of e-journals with respect to affordability, with nearly 70% of responses at Strongly Agree or Agree. The print respondents only had less than 40% of responses at the same level. The print respondents also had a much larger percentage of neutral responses.
Last modified: Monday, 11-Dec-2017 14:40:50 AEDT
© Andrew Treloar, 2001. * http://andrew.treloar.net/ * andrew.treloar@gmail.com
