Hypermedia Online Publishing: the Transformation of the Scholarly Journal
7.3.5 Disadvantages of electronic scholarly publishing
These questions asked respondents to rate a number of possible perceived disadvantages of electronically published scholarly articles on a five-point Likert scale running from Strongly Agree through to Strongly Disagree (SD). As with the advantages, the disadvantages were gathered from a close reading of the critical literature dealing with electronic scholarly journals. Respondents were encouraged to add other disadvantages if they wished to. Only 35 of the 1038 respondents (3.4%) added one additional disadvantage and only 8 added a second.
All of the contingency tables for the print subgroups for this set of questions contained cells with expected values of less than 5 and so the print responses were aggregated and compared with the email responses for each question. This provided valid statistical results for all of the Disadvantages questions; in each case the differences between the print and email responses were significant at p < 0.0001.
A number of respondents had problems with this set of questions. For most of the questions a little over 10% of the print respondents and a little under 10% of the email respondents provided either blank (assumed to mean insufficient knowledge to provide an answer or no opinion) or invalid (most often a question mark) answers.
|
|
One of the standard criticisms of on-line publishing (of all sorts) is the lack of quality. This is perhaps influenced by the number of student homepages visible on the Web in its early days. Of course, quality is medium independent [Harnad, 1995b] and there is no reason to expect that there is anything inherent in on-line publishing that makes quality more difficult to achieve in such an environment.
This question asks respondents to assess poor quality as a disadvantage of electronically published scholarly articles. In contrast to most of the Advantages questions, the responses to this question are clustered much more closely around the Neutral position in the middle of the Likert scale. The (statistically significant) differences between the email and print respondents are most noticeable for the Neutral (where the print respondents agree at almost double the rate of the email respondents) and Disagree (where the situation is almost reversed) dimensions. Clearly the email respondents are less concerned about this perceived disadvantage.
Refereeing
|
|
Another often expressed concern about on-line publishing is the lack of the quality control processes inherent in most print publishing, and usually expressed as 'refereeing' or 'peer review'. In contrast to the previous question, the responses to this question are spread across the Strongly Agree, Agree and Neutral positions on the Likert scale. The differences between the email and print respondents are most evident for Strongly Agree (where the print respondents take a much stronger position) and Disagree or Strongly Disagree (where the email respondents are much more prevalent). While both groups are concerned, the email respondents are much less so.
Copyright
|
|
A range of concerns are often expressed about copyright in an on-line environment. In the experience of the author, most electronic publishing conferences seem to always end up discussing copyright and economics on the last day. Naturally, providers of commercial content of all sorts are concerned that they may lose control of that content, and therefore of the revenue stream that should flow from it. This applies also to journal publishers whether for profit or otherwise. Loss of control of on-line journal articles can potentially translate into loss of sales of subscriptions or individual articles.
This question sought to test respondents' concerns about copyright. The patterns of answers are broadly similar to those for the Refereeing question. The print respondents are more concerned than are the email respondents. They also agree with this disadvantage more than do the email respondents.
Plagiarism
|
|
From the point of view of the scholar (rather than the publisher), plagiarism is a more serious concern than uncontrolled distribution of content. In fact, most scholars would probably prefer the widest possible distribution for their ideas! Of course, plagiarism is not restricted to electronic information; it is just that the ability to easily copy and paste is inherent in most forms of the medium. This question asked whether respondents felt that plagiarism would increase in an environment of electronically published articles.
With the exception of a small difference around the neutral choice, the pattern of responses for this question is almost identical for the Copyright question. It is tempting to assume that the same respondents were responsible for identical answers to both questions. In fact, of the 116 who selected Strongly Agree for the D-Copyright question, only 63 also selected Strongly Agree for D-Plagiarism. This ratio of 2 to 1 is repeated for each level of the Likert scale. The respective numbers are Agree: 321 and 171, Neutral: 322 and 219, Disagree: 140 and 82 and Strongly Disagree: 32 and 14.
Skills
|
|
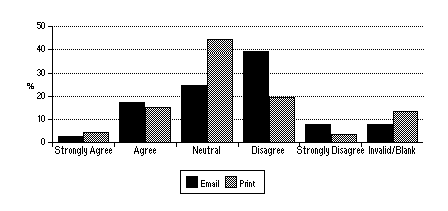
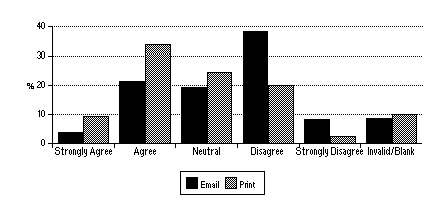
We all learn how to read at school and then learn how to work with the literatures of our professions at university or in the workplace. No-one needs to attend half-day courses in advanced journal reading. And yet the need for special skills to access electronic journals is sometimes cited as a barrier to uptake. This question asked respondents to rank this need as a potential disadvantage.
Once again, the email respondents were much less inclined to regard this as an issue, with the largest single response (nearly 40%) being one of disagreement. On the other hand, over 40% of the print respondents agreed or strongly agreed that this was a disadvantage.
Equipment
|
|
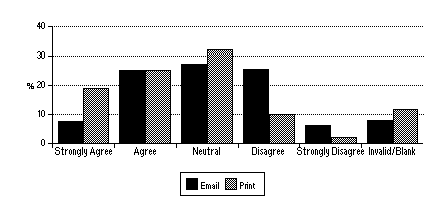
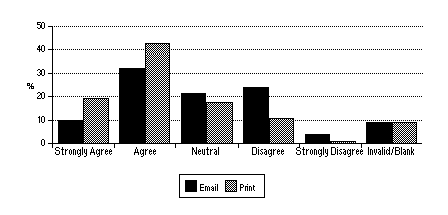
Assuming no physical disability, no-one needs special equipment to read print based scholarly journals. This is not the case for on-line journals. Depending on the level of sophistication of the journal, the reader may require a colour screen, a fast direct network connection, sound output, lots of Random Access Memory (RAM) and a fast Central Processing Unit (CPU) to receive the full effect. For those concerned about access to information, this can be serious issue. This question asked respondents to rate the need for special equipment to access electronic journal articles as a potential disadvantage.
For this question both groups of respondents had patterns of answers that moved towards the strongly agree end of the Likert scale. Over 60% of the print respondents and over 40% of the email respondents either agreed or strongly agreed that this was a disadvantage. The numbers of respondents who strongly disagreed with this disadvantage were the lowest for any of the disadvantage questions. Clearly this is an issue of concern to both groups (although not unexpectedly more so for the print respondents).
Format
|
|
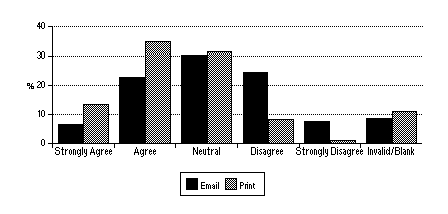
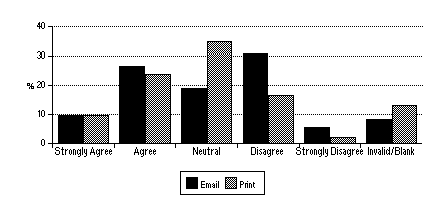
The format of e-journals has sometimes been criticised for not being reader friendly. In addition to the possible negative effects of reading large amounts of text onscreen, readers miss the ability to pick up a journal issue and quickly flick through the table of contents and article pages looking for items of interest. E-journals can (and do) provide alternate navigation mechanisms but these are still different. Once a desired article has been located on-line, the Web provides limited formatting options and a screen resolution significantly lower than print. Adobes' Portable Document Format is an excellent way of distributing 'electronic paper' but is also hard to read on screen. This question sought to probe respondents' attitudes to this issue.
Both groups of respondents had very similar percentages of responses in the strongly agree and agree categories. Their responses in the neutral and disagree categories are almost mirror-images: print respondents are more likely to be neutral (almost a 7:4 ratio) and email respondents more likely to disagree (almost a 2:1 ratio).
Communications Costs
|
|
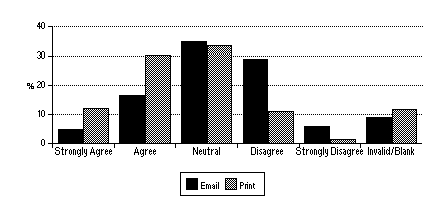
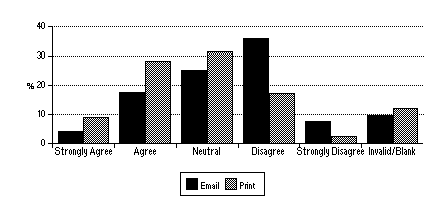
For readers of on-line scholarly journals who are using a modem to access the Internet, communications costs are a significant issue. Even readers using an internal network at their place of work may be liable indirectly for costs if their institution is using some form of chargeback arrangement. These costs are incurred each time the journal is accessed remotely and will probably have some time-based component if a modem is used. This is in contrast to print journals where access is free once the print publication is acquired and where there is no time-based charge for use. This question sought to assess respondents attitudes to this potential disadvantage.
For all of the ratings from Strongly Agree through to Neutral the print respondents were more likely to be concerned about this disadvantage. However, for the Disagree rating, the email respondents provided twice as many responses as the print respondents.
Last modified: Monday, 11-Dec-2017 14:39:44 AEDT
© Andrew Treloar, 2001. * http://andrew.treloar.net/ * andrew.treloar@gmail.com
