Data Curation Continuum Diagrams
Context
This diagram came out of work undertaken at Monash University
in the early 2000s exploring how to support a range of research
infrastructure projects in the context of an institutional
deployment of a research repository.
Diagrams
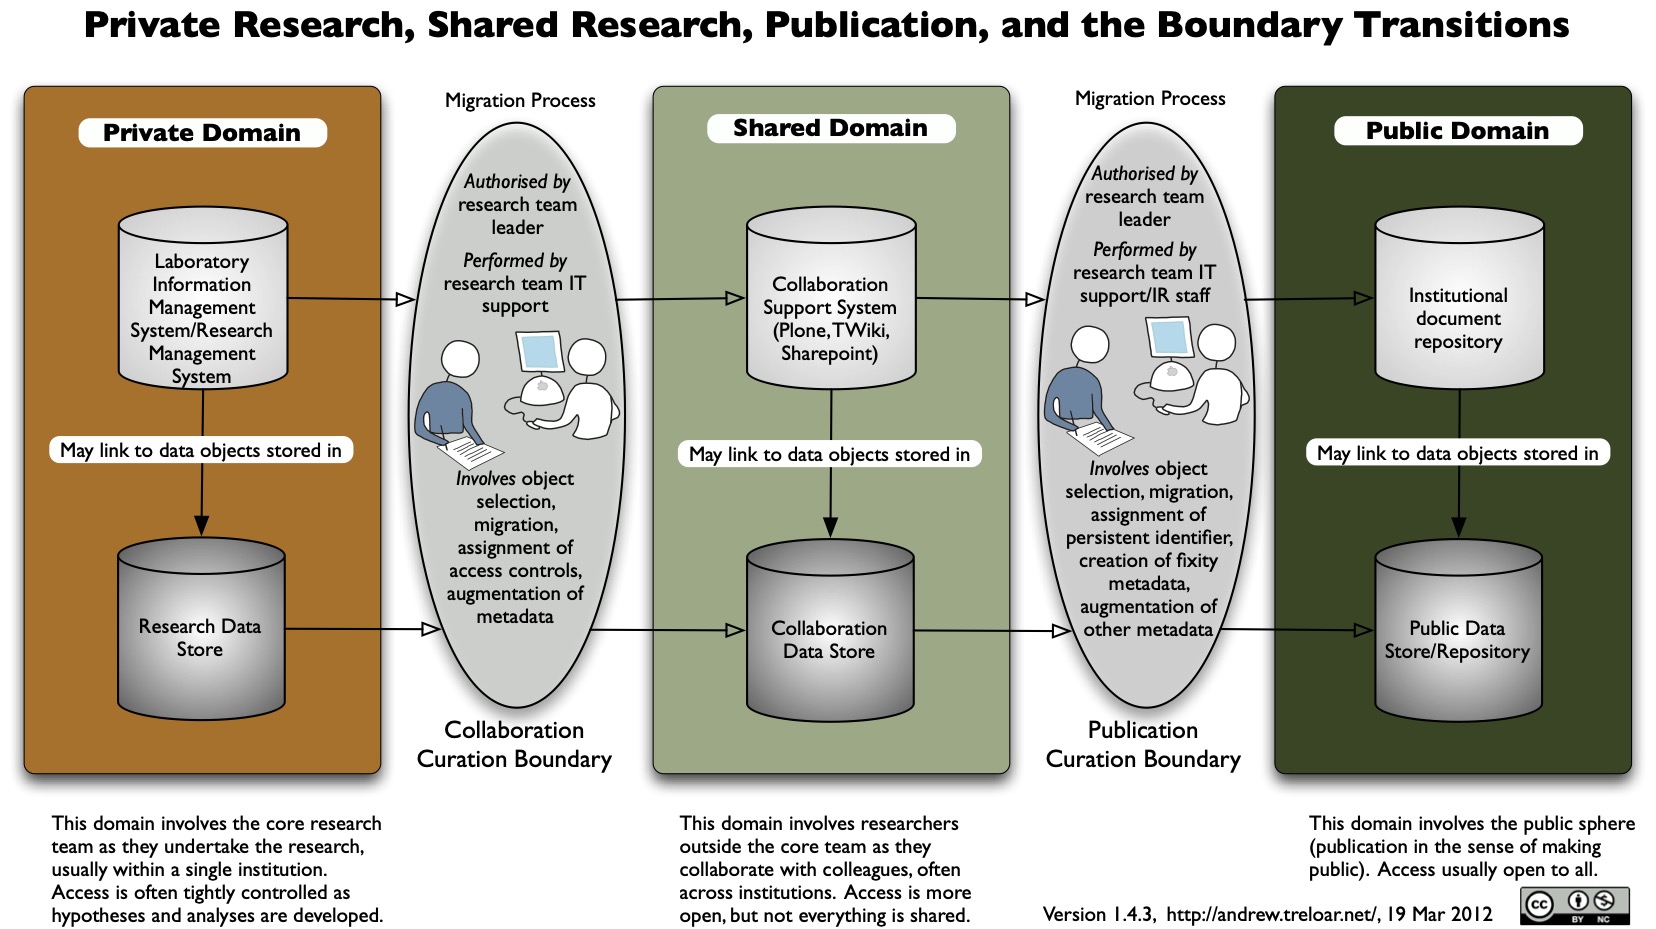
Version 1 of the diagram is this (linked to a PDF version, licensed CC BY NC):
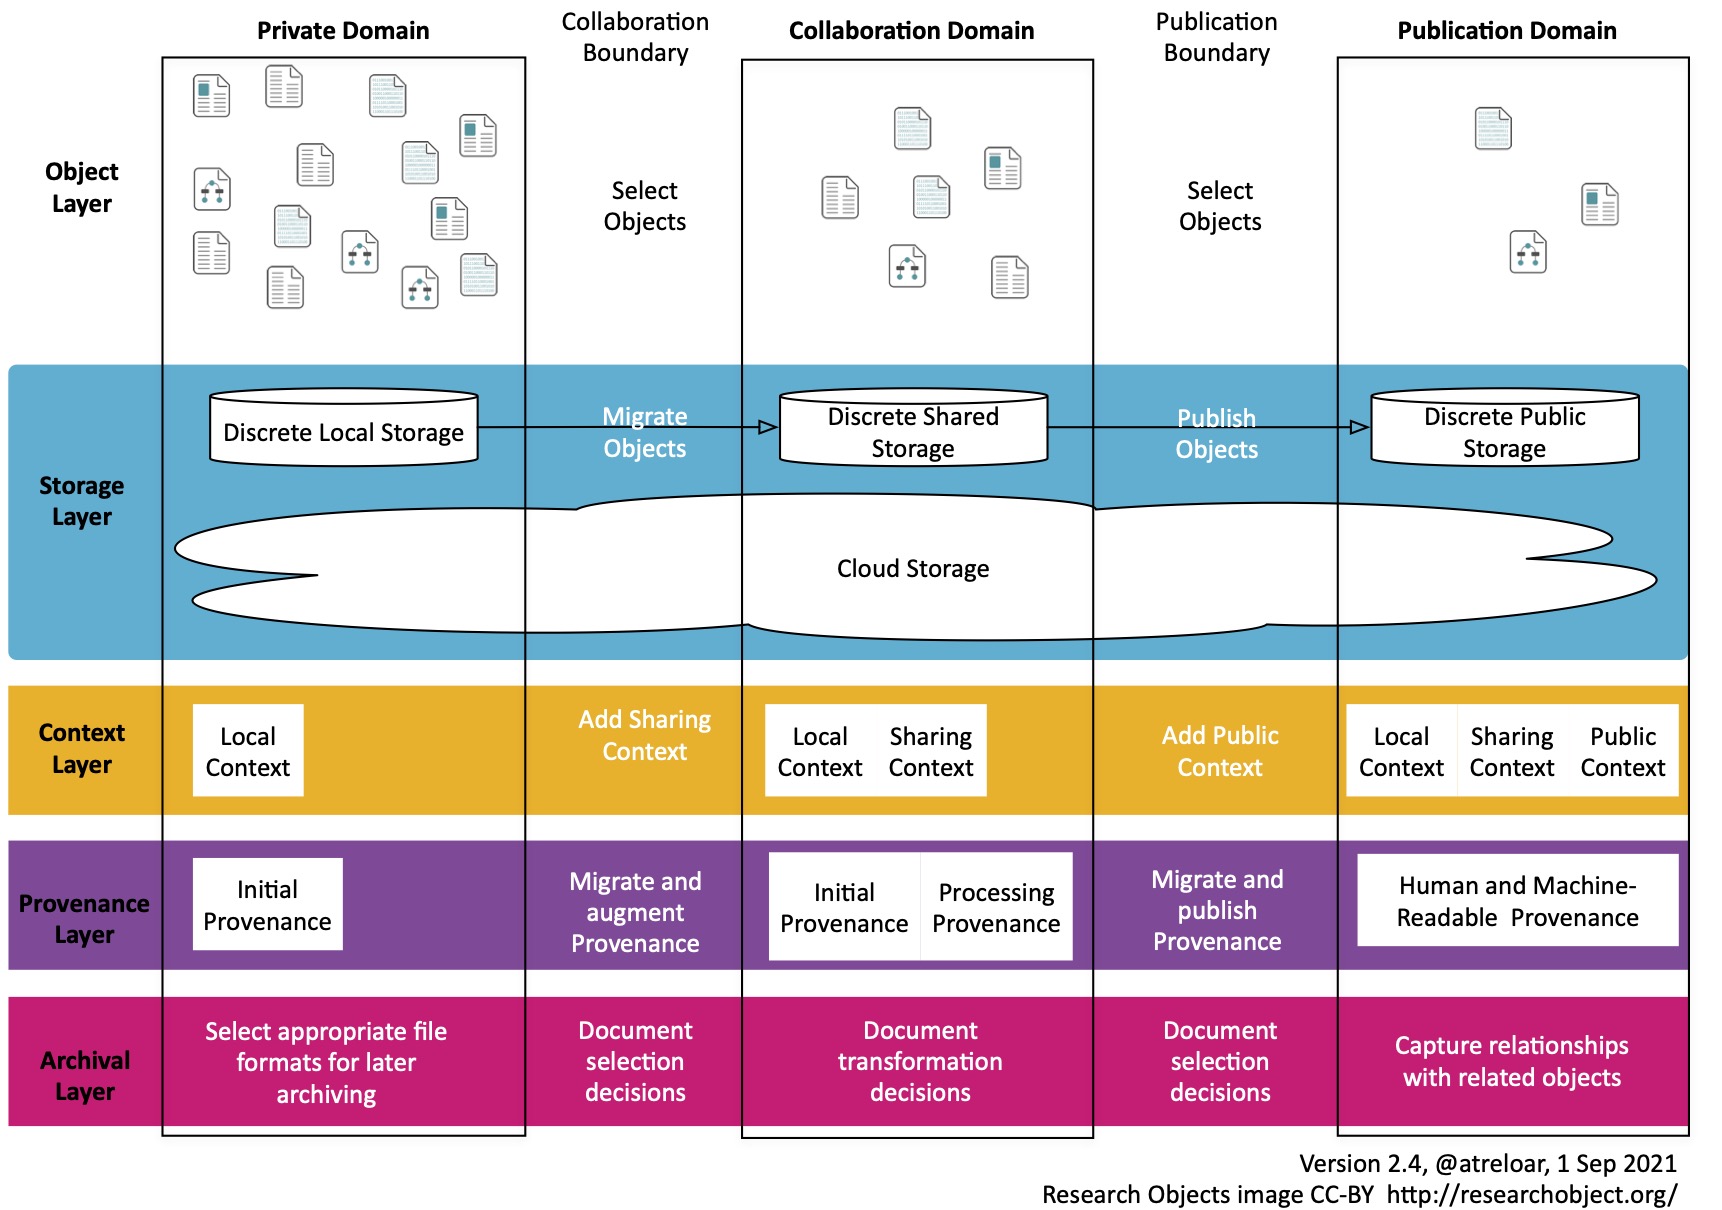
Version 2 of the diagram (updated and with greater nuance) is
this (linked to a PDF version, licensed CC BY):
References
The original Data Curation Continuum work was described in:
Treloar, A., Groenewegen, D. and Harboe-Ree, C. (2007). 'The Data Curation Continuum: managing data objects in institutional repositories', Dlib, September/October. Available online at DOI:10.1045/september2007-treloar.
An improved version of the diagram (the one most often used and cited) was described in:
Treloar, A. and Harboe-Ree, C. (2008). "Data management and the curation continuum: how the Monash experience is informing repository relationships". Proceedings of VALA 2008, Melbourne, February. Available online at http://www.vala.org.au/vala2008-proceedings/vala2008-session-6-treloar.
Google Scholar citations to this publication.
A significantly reworked and rethought version of the diagram was described in a ten-year retrospective article:
Treloar, A. and Klump, J. (2019), "Updating the Data Curation Continuum: not just Data, still focussed on Curation, more Domain-oriented", IJDC 14 (1). Available online at DOI: 10.2218/ijdc.v14i1.643